The UK coffee industry spans supermarket jars, roasteries, coffee shops, workplace machines and the businesses supplying them. The British Coffee Association’s September 2026 update estimates consumption at 103 million cups a day, while separate market research shows both branded chains and independent coffee shops expanding.
In short
- Consumption is not sales: cups drunk, coffee sold by weight, shop turnover and workplace provision measure different things.
- Branded coffee shops: World Coffee Portal’s 2026 report counted 12,313 outlets, up 3.5% over its reporting period.
- Independents: its separate 2026 study counted 13,211 outlets, up 3.3%.
- Instant remains relevant: workplace research published in 2026 found kettle-and-instant provision was still the most widely available format.
- Check definitions before comparing figures: an outlet count does not establish which business sells the most coffee.
How the UK coffee industry is measured
There is no single number that describes the whole UK coffee industry. A supermarket coffee purchase, a café visit and an employer supplying drinks belong to connected but different markets.
The starting distinction is between volume, meaning a physical quantity, and value, meaning sales revenue. Even volume needs a definition: cups consumed and tonnes of packaged coffee are not interchangeable.
| Measure | What it describes | How to read it |
|---|---|---|
| Consumption | Coffee drunk, expressed as cups or a stated weight basis | Check the survey population, period and definition of a cup |
| Retail sales | Packaged coffee bought through shops and other retail channels | Separate sales value, product weight and household purchasing |
| Branded coffee-shop turnover | Estimated store sales within a defined chain market | Check whether food and non-coffee drinks are included |
| Independent coffee shops | Outlets and sales within a separately defined independent market | Do not assume the definition matches everyday usage |
| Workplace coffee | Provision, equipment, ingredients, service and employee behaviour | Distinguish offices from the wider workplace market |
World Coffee Portal describes Project Café UK 2026 as combining outlet and estimated store-sales sizing with industry consultations and consumer research. Its published methodology summary includes more than 30,000 consumer surveys.
That makes it useful for understanding coffee-shop behaviour, but not a substitute for a national consumption survey. Equally, café turnover should not be presented as the value of coffee beans alone.
The wider coffee industry guide provides the framework for understanding how these channels connect.
How much coffee does the UK drink?
The BCA’s update, published on 24 September 2026, puts daily UK consumption at an estimated 103 million cups. It attributes the new consumption figures to research produced by the Centre for Economics and Business Research, or CEBR.
The widely repeated 98 million cups a day is therefore an older benchmark, not the latest BCA headline. The 2026 announcement uses 98 million as its 2018 comparison.
These are estimates, not a count of every drink prepared. The public announcement does not provide enough methodological detail to reconstruct the calculation independently or establish a standard drink size.
Avoid converting the headline directly into litres, caffeine intake or bean requirements. Those calculations would require assumptions about serving size, preparation and dose that the headline does not supply.
For a market reader, the useful conclusion is straightforward: consumption is substantial, but the national cup estimate cannot tell you how much business belongs to supermarkets, cafés or offices.
Retail coffee: instant and fresh serve different occasions
Retail coffee is the packaged product market, rather than the prepared-drink service offered by a café. The BCA’s 2018 economic study examined it separately from foodservice and distinguished instant coffee, ground coffee and coffee pods.
That older study is useful historical evidence, not a current market-share table. It reported that regular instant accounted for 54% of retail coffee sales value in 2017. Repeating that percentage without its date would misrepresent the present market.
It also illustrates why “instant versus fresh” needs care. A share of sales value is not a share of cups consumed, and a share of product weight is different again. Household purchasing does not establish exclusivity: buying instant does not mean a household never buys beans or ground coffee.
For reading market reports, distinguish:
- Product format: instant, beans, ground coffee or capsules.
- Sales channel: grocery retail, direct sales or foodservice.
- Measurement: purchasing households, product weight, servings or sales value.
Do not assume that a busier local café proves instant coffee is disappearing nationally. Nor should the visibility of supermarket jars be used to dismiss demand for freshly prepared drinks.
For the businesses working specifically with roasting and differentiated coffees, see specialty coffee roasters, rather than treating that segment as the whole market.
Out-of-home coffee: chains and independents
World Coffee Portal’s Project Café UK 2026, published in January, counted 12,313 branded outlets, representing 3.5% growth over the preceding reporting period. Its February release reported 420 net additional outlets.
That corrects the approximately 11,876 outlets suggested in the briefing leads. The retrieved 2026 publisher release supports 12,313, and that is the figure used here.
The publisher’s separate Independents Report UK 2026 counted 13,211 independent outlets, up 3.3%. Its public summary describes a sector ranging from specialty-focused businesses to familiar neighbourhood cafés, rather than a uniform collection of espresso bars.
Why Greggs appears in coffee-chain rankings
Allegra’s 5THWAVE Issue 29 reports 2,737 Greggs outlets, ahead of 2,707 Costa Coffee outlets, in the Project Café UK 2026 snapshot. It distinguishes food-focused Greggs from coffee-focused Costa.
This is a ranking by outlet count within that study, not proof that Greggs sold more coffee drinks. The figures are a dated research snapshot, not live estate totals for November.
The distinction matters because the competitive set is wider than businesses people instinctively call coffee shops. A bakery selling coffee can compete for the same purchase occasion as a dedicated café.
What the independent figures tell us
The independent report’s public summary identifies demand for specialty coffee, personal service and the experience of being in the shop. It also describes independent operators as more exposed to inflation than larger chains with greater economies of scale.
Outlet growth should nevertheless be read cautiously. A net increase describes the estate after openings and closures; it does not mean every existing shop improved its performance.
Nor should the branded and independent counts be casually presented as a complete census of every UK location serving coffee. Their definitions and reporting periods need checking first.
Office coffee: demand for better provision, not instant’s disappearance
Office coffee belongs to a wider workplace market that includes hospitals, warehouses and campuses. Findings from that broader population should not automatically be labelled office-only statistics.
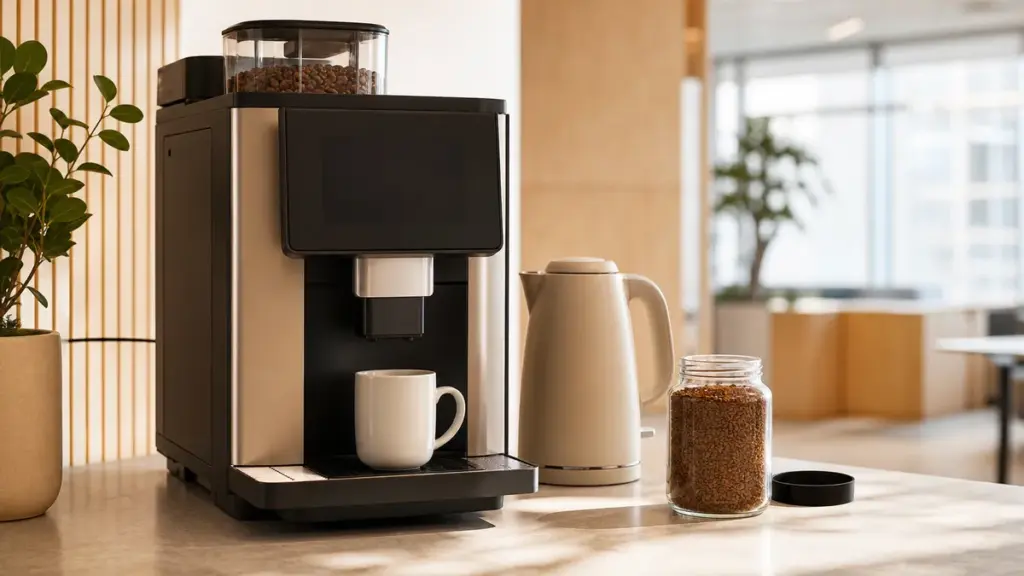
World Coffee Portal’s October summary of The Coffee At Work Report UK 2026 found that 45% of surveyed workplace coffee drinkers typically consumed at least three cups during working hours. Crucially, it says not all those drinks were made, bought or consumed on site.
The same summary reports kettle-and-instant provision at 89%, while bean-to-cup, premium vending and barista provision reached a minority of employees. It also reports strong use of bean-to-cup and barista options where available.
The evidence therefore supports interest in better workplace coffee, not a claim that bean-to-cup machines have already displaced instant across Britain. A survey of preferences and availability is not an installation time series.
For a workplace decision maker, a practical assessment should:
- Record actual attendance by day, rather than relying only on total headcount.
- Count drinks prepared on site separately from drinks bought elsewhere.
- Identify the busiest preparation period and current queues.
- Ask which drinks employees would actually use.
- Compare cleaning, milk handling, water, servicing and staff responsibilities.
- Request itemised written quotations covering equipment, installation, ingredients, maintenance and consumables.
For your own comparison, total the relevant items over the same period and divide by expected drinks actually served. Do not treat a national consumption estimate as a forecast for your workplace.
Jobs: direct employment and wider impact are different
The industry supports work beyond the person handing over a cup. Its supply chain includes importing, warehousing, manufacturing, retailing, equipment and maintenance, alongside hospitality.
The European Coffee Federation’s June 2026 economic-impact report gives a more precise way to interpret employment claims. Its UK table estimates approximately:
- 249,000 direct full-time-equivalent jobs.
- 431,000 direct and indirect jobs combined, called the “core” footprint.
The report states that employment estimates use 2023 data. These are modelled economic contributions, not a November 2026 payroll census.
“Indirect” employment means activity supported among suppliers. A broader measure can also include “induced” effects, associated with spending by people whose incomes depend on the sector.
This explains why an industry jobs headline needs its boundary attached. Comparing an older total-impact estimate with a newer direct-employment estimate would not establish a genuine employment trend. Full-time equivalents also measure labour input, not necessarily the number of individual people employed.
Trends shaping the UK coffee industry
Three developments stand out in the retrieved 2026 research.
Younger adults are changing the customer profile
The BCA reports average consumption among adults aged 18 to 34 increasing from 1.3 cups a day in 2021 to 1.9 in 2026. That is survey-based evidence of changing habits, not proof that every younger customer wants the same drink.
The practical response is to examine customer preferences rather than assume a single national coffee-drinker profile.
Coffee competition extends beyond traditional cafés
Greggs’ position in the branded ranking makes food-led competition particularly visible. World Coffee Portal also highlights iced drinks, matcha and higher-end hospitality experiences in its 2026 branded-market summary.
Matcha is not coffee, so growth in a café’s wider drinks menu should not automatically be described as growth in coffee consumption. The distinction between the business and the ingredient remains essential.
Workplace quality is an opportunity, not a completed transition
The workplace findings show a gap between widespread instant provision and interest in other formats. For suppliers and employers, that suggests a reason to investigate local demand, not a reason to assume universal machine replacement.
Our market trends guide examines these developments more closely. When assessing the UK coffee industry, keep asking: which channel, which measure and which date?
FAQ
Does growth in coffee-shop sales mean people are drinking more coffee?
No, sales growth alone does not establish higher coffee consumption. Revenue can change because of the mix of products sold, including food and non-coffee drinks, as well as changes in transactions and selling prices. Look for a separately reported volume or transaction measure before describing sales growth as growth in cups drunk.
Is there a verified national figure for offices switching to bean-to-cup?
The retrieved public 2026 workplace summary does not provide a national installation trend. It reports availability, preferences and use, which are different measures. Its findings support interest in bean-to-cup provision, but establishing the pace of replacement would require comparable equipment or workplace data collected over time.
Why do coffee-industry employment figures vary so much?
They can count different parts of the economy and different kinds of employment. Direct jobs, supplier-supported jobs and wider spending effects are not interchangeable. Reports may also use full-time equivalents rather than headcounts. Check the underlying data year as well as the publication date before comparing two headline figures.
Where to go next
Read Coffee Industry for the wider supply-chain framework and Market Trends for closer examination of changing demand. Specialty Coffee Roasters explores that distinct business segment, while Farmgate Prices and Farmer Income explains why activity in a consuming market does not describe producers’ livelihoods.
Sources
-
British Coffee Association, UK Coffee Consumption Rises to 103 Million Cups Every Day: Powered by a New Generation, September 2026. Consumption update and age-group findings.
URL: https://britishcoffeeassociation.org/uk-coffee-consumption-rises-to-103-million-cups-every-day-powered-by-a-new-generation/
Publication date checked against the BCA news index: https://britishcoffeeassociation.org/news/. -
Allegra World Coffee Portal, Project Café UK 2026, 21 January 2026, public report description. Market scope and research approach.
URL: https://www.worldcoffeeportal.com/industry-report/project-cafe-uk-2026/. -
Allegra World Coffee Portal, UK branded coffee shop market achieves 3.5% outlet growth, 3 February 2026, public release. Outlet count, net additions and headline trends.
URL: https://www.worldcoffeeportal.com/news/6-8bn-uk-branded-coffee-shop-market-achieves-3-5-outlet-growth-full-story-data-download/. -
Allegra World Coffee Portal, 5THWAVE, Issue 29, 2026, page 7. Project Café UK chain-ranking snapshot. Publisher-produced magazine retrieved from a public institutional mirror.
URL: https://rondonia.ro.gov.br/wp-content/uploads/2026/03/5THWAVE-%E2%80%93-Issue-29-Revista-internacional-especializada-em-cafe.pdf. -
Allegra World Coffee Portal, 3 key findings from World Coffee Portal’s latest UK independent coffee shop market report, 18 February 2026, public summary.
URL: https://www.worldcoffeeportal.com/analysis/3-key-findings-from-world-coffee-portals-latest-report-on-the-uk-independent-coffee-shop-market/. -
Allegra World Coffee Portal, Workplaces: the next big opportunity for UK coffee businesses, 19 October 2026, public summary of The Coffee At Work Report UK 2026.
URL: https://www.worldcoffeeportal.com/news/workplaces-the-next-big-opportunity-for-uk-coffee-businesses/. -
European Coffee Federation / Europe Economics, Economic Impact of Coffee in Europe, June 2026, employment methodology and UK Table 5.14.
URL: https://www.ecf-coffee.org/wp-content/uploads/2026/06/ECF_Economic-Impact-of-Coffee-in-Europe.pdf. -
Centre for Economics and Business Research for the British Coffee Association, The UK coffee market and its impact on the economy, April 2018. Historical retail categories and market-measurement framework.
URL: https://britishcoffeeassociation.org/wp-content/uploads/2021/12/The-UK-coffee-industry-and-its-impact-on-the-economy_2018-CEBR-report.pdf.
This article was researched using retrieved trade-association releases, research publishers’ public summaries and economic reports, with historical figures distinguished from current publication-year findings.
Last checked: November 2026