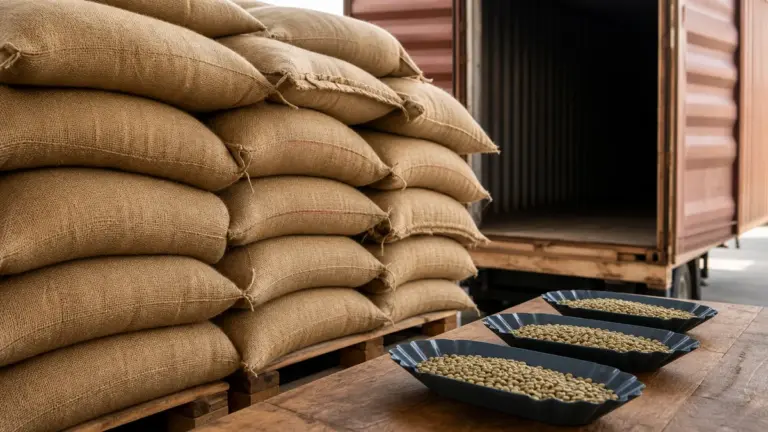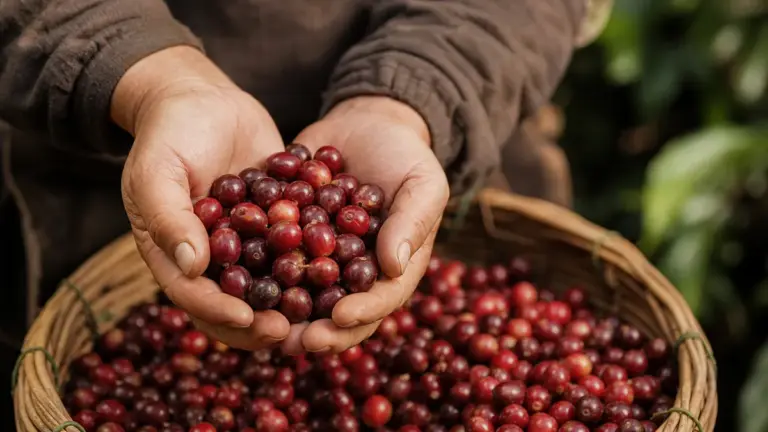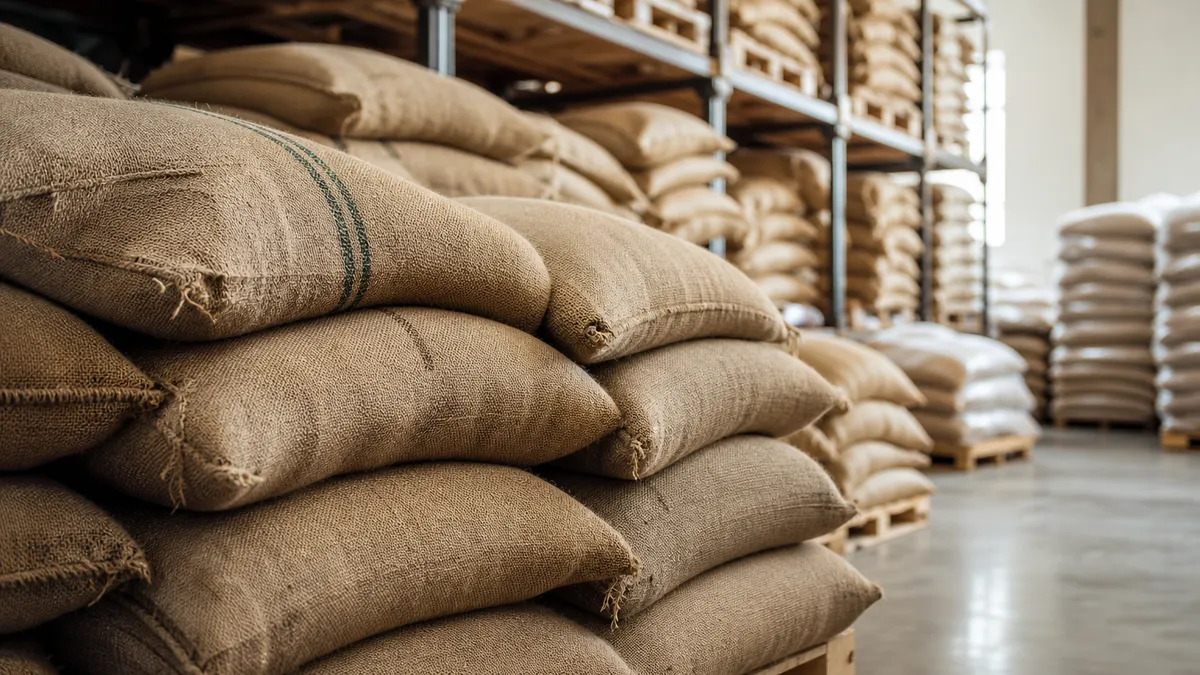
The global coffee industry connects farmers, processors, traders, roasters and retailers to turn coffee cherries into drinks. Its physical scale is measured in green coffee, with the International Coffee Organization estimating production of 183.6 million 60 kg bags and consumption of 180.6 million bags for coffee year 2025/26.
In short
- Coffee production, exports and consumption measure different things. They should not be used interchangeably.
- Brazil and Vietnam together account for nearly half of world production, making conditions in those countries especially influential.
- Exporters prepare coffee for international sale; importers connect those shipments with roasters and other buyers.
- A participant’s share of retail value is not its profit, and export earnings are not farmers’ take-home income.
- Traceability, changing drinking habits, climate resilience and the distribution of value are central industry challenges.
The global coffee industry in numbers
Coffee statistics usually describe green coffee, meaning beans before roasting, or processed products converted into their green-coffee equivalent. A statistical bag represents 60 kg, not necessarily the weight of an individual sack in a warehouse.
The ICO’s September 2026 Coffee Market Report gives the following estimates:
| Measure | Coffee year 2024/25 | Coffee year 2025/26 |
|---|---|---|
| World production | 175.9 million bags | 183.6 million bags |
| World consumption | 182.2 million bags | 180.6 million bags |
| Production minus consumption | Deficit of 6.3 million bags | Surplus of 3.0 million bags |
These are estimates for October to September, not calendar-year totals. The ICO calculates apparent consumption using production, net trade and stock changes where applicable, rather than counting individual drinks.
That distinction matters when comparing reports. National harvest calendars differ, statistical agencies revise their estimates, and a forecast published before harvest is not equivalent to a later assessment. Earlier figures around 178 million bags should not be combined with newer consumption estimates to calculate a balance.
Production is geographically concentrated. FAO identifies Brazil and Vietnam as accounting for nearly half of global output, while the European Union and United States are leading importing and consuming markets. Growing countries also drink coffee themselves: production does not automatically become an export.
For the wider set of topics behind these numbers, start with our coffee industry guide.
From farm to retail: how the value chain works
A value chain is the sequence of activities that turns a raw material into something a customer buys. Coffee’s chain includes physical transformation, transport, quality assessment, financing and selling.
The simplest route looks like this, although businesses can combine several stages.
- Farmers grow and harvest coffee. They manage trees and collect the cherries containing the coffee seeds. Their output may leave the farm as cherries, partly processed coffee or dried green beans, depending on local arrangements.
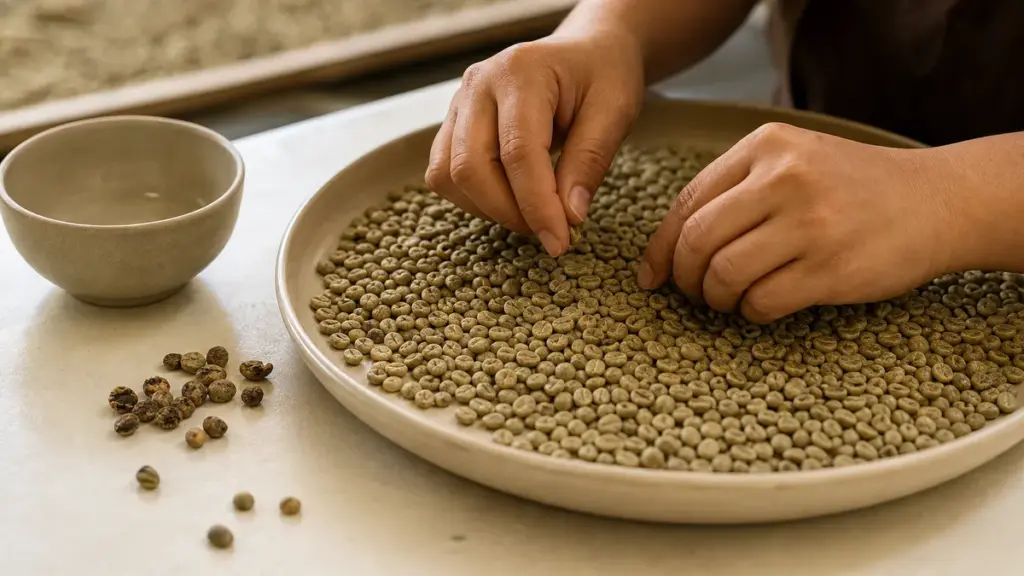
- Processors prepare the beans. Processing removes fruit material and dries the coffee. Milling and sorting then prepare green beans for the required quality specification.
- Exporters assemble and dispatch shipments. They connect local supply with overseas contracts, arranging preparation, documentation and delivery responsibilities.
- Importers and traders connect supply with buyers. They organise purchases, logistics and stock availability, often supplying quantities suited to individual roasters.
- Roasters, manufacturers and retailers reach the customer. Coffee becomes roasted beans, ground coffee, soluble coffee or other finished products, then enters shops, hospitality and workplace supply channels.
This is not a compulsory five-business relay. A cooperative may process and export its members’ coffee, while a roasting business may import directly or sell through its own shops.
The useful question is therefore not simply “How many middlemen are there?” It is “Who performs each job, carries each risk and receives payment for doing it?” Removing an intermediary does not remove the need for transport, quality control or working capital, meaning the finance needed while goods move through the business.
What exporters, importers, roasters and retailers contribute
Exporters operate at the connection between producing-country supply and international buyers. A shipment must meet agreed requirements, not merely contain coffee from the right country.
Importers make overseas supply accessible to destination-market buyers. An importer holding coffee locally can supply a roaster without that roaster having to organise a complete international shipment.
Roasters and manufacturers turn green coffee into finished products. Their role includes selecting inputs, maintaining product consistency and deciding how coffee is presented to customers.
Retailers and food-service businesses provide the final route to consumption. Selling a sealed packet and preparing a drink are different activities, so their revenues and operating requirements should not be treated as directly comparable.
These functions can sit within independent businesses or larger groups. Our key players overview explains the types of organisation involved without turning this introduction into a company directory.
Market value, export earnings and retail spending are different
There is no useful answer to “How big is the coffee market?” until the measurement is defined.
Export earnings record coffee sold across a border. A properly specified total identifies the exporting countries, reporting period and products included, such as green, roasted or soluble coffee.
Retail spending records purchases by final customers. Its scope might cover supermarket packets, prepared drinks or both. A café transaction includes preparation and service, not just the agricultural product.
Global market value is an umbrella expression rather than a single statistical measure. Different reports may include different products, sales channels and geographical coverage.
Do not add these totals together: coffee can appear in an export transaction and later in a retail transaction. Nor should a producing country’s export receipts be described as the income retained by its farmers.
When reading a monetary market report, check its period, currency, treatment of inflation and taxes, and whether it measures sales or value added. Value added measures the additional value created at a stage, rather than counting the full transaction again.
Who earns what?
There is no defensible universal percentage showing what every coffee farmer receives from every finished drink.
BASIC’s 2024 study, commissioned by the Global Coffee Platform, IDH and Solidaridad, modelled coffee from Brazil, Colombia, Ethiopia and Vietnam sold through German retailers in 2021. Its estimates illustrate how distribution changes with product format.
| Stage | National brands: ground coffee | National brands: whole beans |
|---|---|---|
| Coffee cultivation | 24% | 21% |
| Collection, export and international transport combined | 9.9% | 6.7% |
| Roasting | 12% | 23% |
| Retail | 21% | 21% |
| German coffee tax | 27% | 22% |
These are rounded shares of final retail value, not profit margins. VAT is separate, so the displayed rows are not a complete breakdown. Farming receipts must cover production expenses, and the study’s net farm income also remunerates family labour.
At the broader level, the Coffee Barometer 2026 describes value concentrating downstream, in consuming-country activities such as branding and retail. It cites an ICO 2020 estimate that producing countries’ share of final retail value had fallen from about 30% in the early 1990s to around 10%.
That is a historical comparison cited by a later report, not a newly measured 2026 farmer-income share. It also concerns producing countries, including activities beyond farming.
The practical lesson is to ask what a percentage measures before repeating it. A share of export receipts, a share of packet sales and a household’s net income answer different questions.
The trends changing the industry
Convenience and differentiated products
CBI’s February 2026 European market assessment identifies ready-to-drink coffee, specialty coffee and product customisation as important trends. These are changes in what people buy and how they consume it, not proof that every market is moving in the same direction.
A bottled coffee drink creates a different manufacturing and distribution chain from a bag of roasted beans. Equally, demand for named origins and distinctive flavours can require more detailed separation and documentation of individual lots.
Sustainability claims face a demand test
Producing certified coffee and selling it as certified are different outcomes. IISD’s August 2026 report estimates that only about 51% of certified coffee production was actually sold as certified.
Certification capacity alone therefore does not establish buyer demand. For a sourcing claim, ask which standard applies, what volume it covers and whether the statement describes production, purchasing or a future commitment.
Traceability is becoming a market-access requirement
Traceability means being able to follow coffee through its supply chain. For EU trade, the EU Deforestation Regulation makes evidence about origin and deforestation relevant to market access.
As checked in November 2026, the European Commission lists application from 30 December 2026 for large and medium operators, and 30 June 2027 for most micro and small operators. Newly added soluble coffee products have a separate application date of 30 December 2027.
These are EU requirements, not a blanket statement of UK domestic law. Businesses serving EU customers need to check their product scope and responsibilities.
The industry’s hardest challenges
Climate resilience requires long-term work. World Coffee Research identifies breeding and access to better varieties as essential responses to changing production conditions. New planting material must work in local farming systems, so adaptation involves research, field testing and delivery to farmers, not simply announcing a new variety.
Farm and worker livelihoods remain vulnerable. The Coffee Barometer 2026 highlights unpaid family labour and weak protections for seasonal workers. More valuable finished products do not automatically resolve those problems.
Concentration creates dependency. Reliance on a small number of major producing origins exposes the wider chain to disruption. Concentrated buying also makes procurement practices important, which is why ownership and scale deserve separate attention in Coffee Industry Giants.
Better coordination must reach the farm. The ICO’s value-chain research identifies durable relationships, producer organisations and access to knowledge and finance as mechanisms that can support participation. The test is whether arrangements improve producers’ position, not simply whether another programme exists.
A checklist for reading industry claims
Use these questions whenever a report makes a striking claim about the global coffee industry:
- What is being measured? Production, exports, consumption, sales, profit or household income?
- Which period applies? Calendar year, coffee year, harvest year or forecast?
- What is the unit? Tonnes, 60 kg bags, green-coffee equivalent or finished products?
- Whose experience is represented? One origin, one retail market or the world?
- What sits behind the headline? Check the method, revisions, exclusions and original source.
This is also a useful way to question a supplier’s sustainability statement: ask for the underlying evidence and its scope, rather than treating a broad promise as a measured result.
FAQ
Does “direct trade” mean there are no importers?
No, direct trade can still involve exporters and importers. The International Trade Centre explains that farmers and roasters may need specialist support with international logistics and trading requirements, particularly for smaller volumes. A close producer relationship describes how businesses work together; it does not necessarily describe every organisation handling the coffee.
Is coffee consumed only in countries that import it?
No, producing countries also have domestic coffee markets. FAO includes Brazil among the largest consumers, alongside the United States, European Union and Japan. This is why export volume cannot stand in for production: some coffee stays in its country of origin, and stocks can also change between reporting periods.
Can a global coffee surplus still coincide with supply problems?
Yes, an overall surplus does not guarantee that every buyer can obtain the origin, quality or delivery window it needs. The ICO’s value-chain analysis distinguishes aggregate supply from the chain’s resilience to shocks. For practical purchasing, the availability of suitable coffee matters alongside the worldwide production total.
Where to go next
Read Coffee Industry to explore the wider subject, then Key Players for the organisations performing each role. Coffee Industry Giants examines the scale and ownership behind the largest businesses, building on this explanation of how the global coffee industry works.
Sources
-
International Coffee Organization, Coffee Market Report: September 2026, 2026, especially Tables 3 and 4 and the explanatory note.
https://www.ico.org/documents/cy2025-26/cmr-0926-e.pdf
Production, consumption, trade units and reporting basis. -
International Coffee Organization, Coffee Market Report: August 2026, 2026, supply-and-demand discussion and methodological footnotes.
https://www.ico.org/documents/cy2025-26/cmr-0826-e.pdf
Apparent consumption and coffee-year methodology. -
Food and Agriculture Organization of the United Nations, Coffee: facts, data and global perspective, 2026 web resource.
https://www.fao.org/coffee
Production concentration, leading markets and domestic consumption. -
International Trade Centre, The Coffee Guide, fourth edition, 2021.
https://www.intracen.org/media/5718
Trading functions, processing, market channels and direct trade. -
International Coffee Organization, Coffee Development Report 2020: The Value of Coffee, 2020.
https://www.ico.org/wp-content/uploads/2022/11/CDR2020.pdf
Value-chain structure, resilience, value addition and producer participation. -
BASIC, commissioned by Global Coffee Platform, IDH and Solidaridad, The Grounds for Sharing: A study of value distribution in the coffee industry, final version dated 6 August 2024.
https://basic.coop/v2/content/uploads/2024/10/The-Grounds-for-Sharing-A-study-of-value-distribution-in-the-coffee-industry-6Aug2024-FINAL.pdf
Modelled distribution in German retail coffee using 2021 data. -
Ethos Agriculture, Conservation International, Solidaridad and VOCAL, Coffee Barometer 2026, 2026.
https://vocalnetwork.org/app/uploads/sites/3/2026/06/Coffee-Barometer-2026.pdf
Producing-country value shares, labour and structural challenges. -
CBI, Netherlands Ministry of Foreign Affairs, Which trends offer opportunities or pose threats in the European coffee market?, updated 17 February 2026.
https://www.cbi.eu/sites/default/files/pdf/research/796.pdf
European product and consumption trends. -
International Institute for Sustainable Development, Global Market Report: Coffee and sustainability, 24 August 2026.
https://www.iisd.org/publications/report/global-market-report-coffee-sustainability
Certified production and the gap between certified supply and sales. -
European Commission, Directorate-General for Environment, Regulation on Deforestation-free products, current implementation page, 2026.
https://environment.ec.europa.eu/topics/forests/deforestation/regulation-deforestation-free-products_en
Product coverage and application dates checked in November 2026. -
World Coffee Research, Why breeding?, undated programme explainer.
https://worldcoffeeresearch.org/programs/why-breeding
Variety development, local adaptation and long-term supply resilience.
Research combined retrieved intergovernmental statistics, trade guidance, a modelled value-distribution study, sustainability research and current European Commission guidance; no first-hand testing was undertaken.
Last checked: November 2026