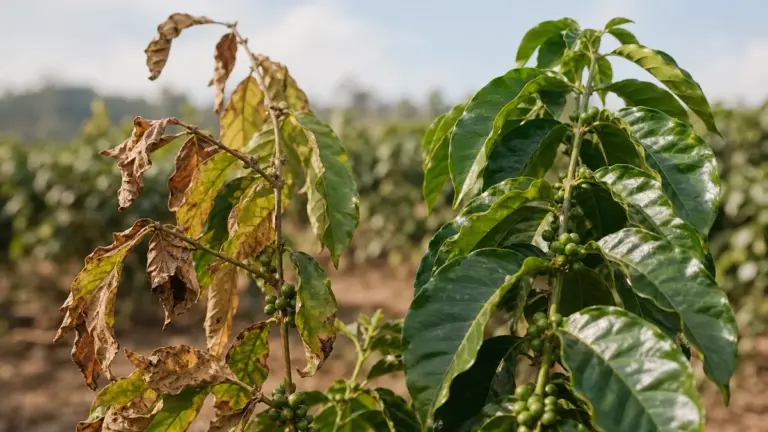
Coffee affects the environment through farming, land use, processing, transport, brewing and waste, with milk adding another agricultural footprint. Growing the beans and preparing the finished drink are often major sources of emissions, but their relative importance changes with the farm, recipe, equipment and electricity supply.
In short
- Compare complete drinks, not just beans or packaging: include coffee dose, milk, brewing energy and waste.
- Carbon emissions are only part of the picture. Forest protection, biodiversity, water scarcity and pollution also matter.
- A water-footprint figure is not the same as water taken from a tap or river.
- Preventing wasted coffee avoids wasting the resources already used to produce it.
- Check environmental claims against specific evidence and the collection services actually available to you.
Coffee and the environment: follow the whole life cycle
A life cycle assessment, or LCA, estimates environmental impacts across a defined product system. For coffee, that might mean everything from growing seedlings to disposing of grounds, or it might stop at the farm gate. Those are different questions, and their results are not interchangeable.
The distinction between producing coffee and serving a drink is particularly important. A footprint for green coffee, meaning unroasted beans, does not automatically include roasting, brewing, milk or washing the mug.
| Life cycle stage | Where impacts arise | What to investigate |
|---|---|---|
| Farming and land use | Fertiliser, agricultural energy, irrigation and land conversion | Farm practices and land-use history |
| Processing and roasting | Water use, wastewater treatment, drying and roasting energy | Mill management and energy sources |
| Packaging and distribution | Material manufacture, freight and delivery | Packaging weight, transport mode and disposal |
| Preparing and drinking | Coffee dose, water heating, milk, refrigeration and washing | The actual recipe and equipment use |
| End of life | Unused drinks, grounds, packaging and equipment disposal | Waste prevention and suitable collection |
There is no reliable percentage split that describes every cup. A Finnish supply-chain study published in 2020 found cultivation contributed 32 to 78% of the assessed carbon footprint, while consumption contributed 19 to 49%. These were results for its particular coffee chains and scenarios, not universal averages.
The wider coffee and the environment hub maps the individual subjects. Here, the aim is to show how they fit together without treating one visible problem as the whole story.
Land use, forests and biodiversity
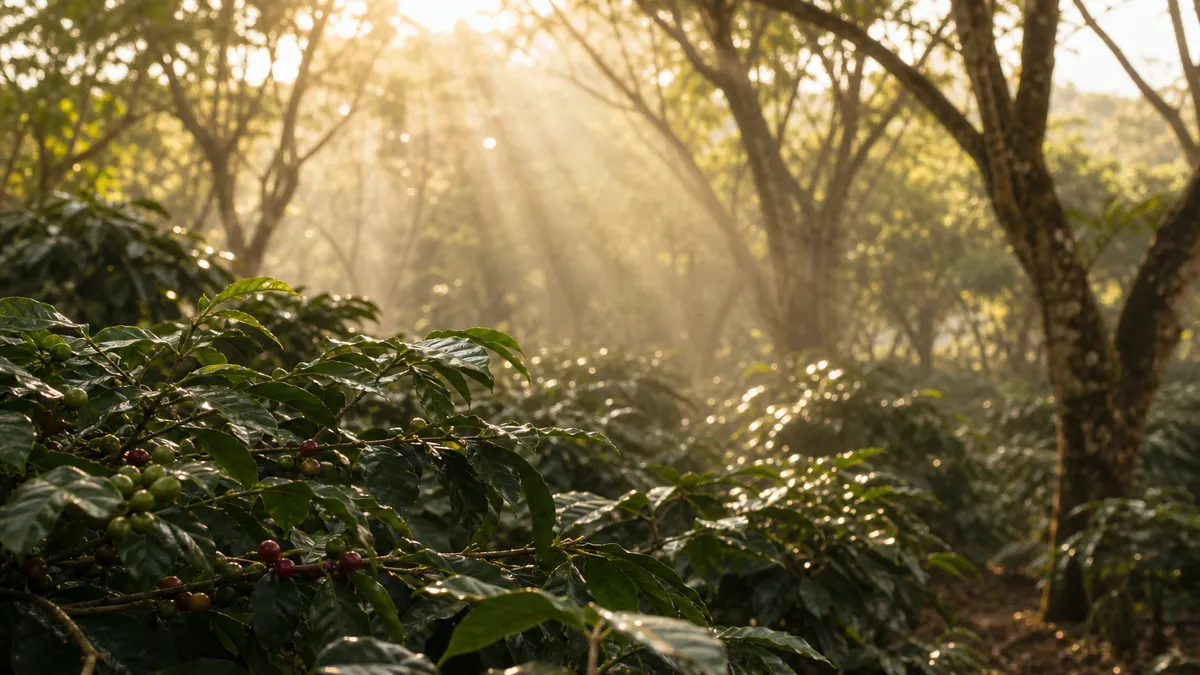
Coffee farming occupies land, and how that land is managed matters alongside the quantity of beans harvested. Clearing forest for agriculture releases stored carbon and removes habitat; retaining trees within farms can support wildlife and other ecological functions.
Agroforestry means growing agricultural crops alongside trees. In coffee systems, those trees can provide habitat, store carbon and influence soil and water conditions. However, a shaded plantation is not an ecological replacement for an intact natural forest.
The evidence does not support a simple choice between “productive sun coffee” and “unproductive shade coffee”. A global meta-analysis published in 2022 found that yield responses depended on shade management and local conditions. Moderate shade could maintain yields comparable with full-sun systems, while heavier shade sometimes reduced production.
This creates two questions for a supplier:
- Was natural habitat converted to establish or expand production?
- How is the existing farm managed to protect biodiversity and maintain productive soil?
Ask for traceability and evidence of forest protection rather than relying on a photograph of trees. Climate-related risks and changing growing conditions are examined separately in coffee and climate change.
Water: volume, scarcity and pollution are different
Coffee’s water impact is not captured by the amount poured into a brewer. Farming and processing must be considered too, but headline water-footprint figures need careful interpretation.
The Water Footprint Network gives a global average of approximately 130 litres for a 125 ml coffee made with 7 g of roasted coffee. This is a supply-chain estimate based on historical production data, not a measurement of water withdrawn to prepare your particular drink.
Water-footprint accounting distinguishes:
- Green water: rainfall stored in soil and used by plants.
- Blue water: surface water or groundwater consumed during production.
- Grey water: a calculated volume needed to assimilate pollution to specified water-quality standards, not necessarily water physically withdrawn.
Adding these categories produces a different measure from assessing local water scarcity. Rainfall used by a crop and irrigation drawn from a stressed catchment cannot be interpreted as equivalent environmental pressures merely because both are expressed in litres.
In the Finnish coffee study, irrigation was the main contributor to assessed water-scarcity impacts. Location and farming system therefore mattered substantially.
Processing also raises a separate pollution issue. Wastewater from wet coffee processing contains organic material; its breakdown can consume oxygen in receiving waters. Responsible treatment matters, not simply reducing the volume used. Ask how a mill manages wastewater rather than assuming a processing name proves good environmental performance.
Milk changes the finished drink
A black coffee and a milk-heavy drink are not environmentally equivalent servings. Dairy milk brings impacts from cattle, feed production and manure management, including methane associated with digestion.
Life cycle research generally finds lower greenhouse gas emissions for plant-based drinks than for animal milk, although results vary between products and assessment methods. Lower climate impact does not automatically mean lower impact in every category: ingredient production, irrigation, processing and packaging can change water and other results.
The amount used matters as well as the type. Compare the same coffee recipe with a stated milk volume, and include milk discarded during preparation or left in the cup.
For offices, offer a plant-based option that people will actually drink, assess demand before opening cartons and monitor discarded milk. An alternative that is routinely thrown away is not a well-managed substitution. Environmental comparisons also do not establish nutritional equivalence between drinks.
Packaging and pods: assess more than the bin
Packaging has manufacturing and disposal impacts, but its visibility can distort the discussion. A pod in the bin is obvious; agricultural inputs and electricity used earlier in the chain are not.
Coffee LCAs show that rankings between brewing systems depend on assumptions, including the coffee dose, energy use, unused brewed coffee and disposal route. A capsule system can therefore compare differently with carefully portioned filter coffee than with a large batch partly discarded.
An older comparative study found capsule espresso had lower assessed impacts per serving than drip-filter coffee in its modelled scenarios, while spray-dried instant coffee performed better than both. That is evidence about those systems, not a permanent ranking of every modern machine or pod.
For packaging, ask what material it is, what must be separated and who will collect it. “Recyclable” and “compostable” describe different routes, neither of which should be assumed from appearance.
In England, DEFRA guidance says packaging labelled compostable or biodegradable cannot go into ordinary workplace food-waste collections. It needs a dedicated collection or must be treated as non-recyclable waste. A compostable coffee pod is therefore not permission to put it beside the grounds.
What drinkers and offices can do
Start with a simple audit of what enters the coffee area and what leaves unused. The following is a practical checklist, not a claim that every action has the same benefit everywhere.
- Prevent wasted drinks. Record unfinished coffee and discarded batches, then adjust serving sizes or batch preparation. Wasting the drink also wastes the farming, processing and preparation behind it.
- Measure the recipe. Record coffee in grams and milk in millilitres. Compare alternatives on that basis rather than by an undefined “cup”.
- Heat only what is needed. Avoid routinely boiling excess water or keeping unused coffee hot. Follow equipment instructions when configuring standby and operating schedules.
- Include the whole tea point. Ask about brewing electricity, milk refrigeration, rinsing and cup washing, rather than looking only at the machine’s brewing cycle.
- Ask better sourcing questions. Request origin traceability, forest-protection evidence, farm-management information and explanations of certification scope.
- Match waste bins to real collections. Confirm accepted materials with the collector before choosing bags, pods or cups.
- Review measured results. Track wasted drinks, milk discarded, electricity where measurable and collection contamination. Repeat the audit after changes.
For an office comparing suppliers, request the same evidence from each: drink recipe, operating assumptions, assessment boundary and disposal scenario. A result for black coffee should not be used to advertise a milk drink.
A specific requirement for workplaces in England
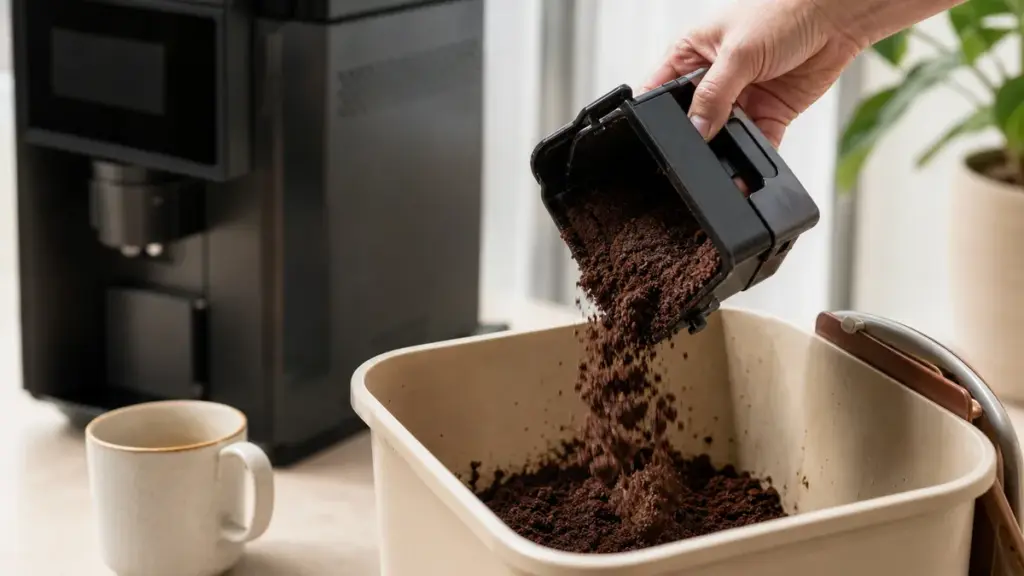
As checked in November 2026, England’s Simpler Recycling rules require workplaces to separate food waste, including coffee grounds. The rules took effect on 31 March 2025, with micro-firms employing fewer than 10 full-time-equivalent staff given until 31 March 2027.
That employee threshold applies across the business, not separately to each location. Do not apply England’s timetable across the UK; check the relevant national guidance and your collector’s instructions.
How to read footprint comparisons properly
Before accepting a claim that one coffee is environmentally better, check its functional unit, meaning the amount or service being compared. A kilogram of roasted beans, a small espresso and a large milk drink are different units.
Then check the system boundary, meaning which activities are included. Does the assessment cover land-use change, equipment, milk, washing and disposal? What electricity supply does it assume? Does it count a prepared drink or a drink actually consumed?
Allocation also matters. This is how an assessment divides impacts between products or co-products. Different defensible choices can produce different results without either study being fraudulent.
Finally, identify the environmental indicator. CO₂e, or carbon dioxide equivalent, combines greenhouse gases into a common climate measure. It does not measure wildlife loss or river pollution. The separate carbon footprint guide explains climate accounting in more detail.
Treat green claims as questions, not answers
The UK Competition and Markets Authority’s Green Claims Code says environmental claims should be truthful, clear, substantiated and considered in their life cycle context. Important limitations should not be hidden.
Translate broad claims into specific questions:
- “Recyclable”: which components, through which collection?
- “Compostable”: under what conditions, and where is it accepted?
- “Lower carbon”: compared with what recipe, boundary and baseline?
- “Carbon neutral”: what emissions were measured, reduced and offset?
Certification can help answer particular questions, but its scope matters. For example, Smithsonian Bird Friendly certification requires organic certification and independently inspected habitat standards. That is relevant evidence about farming, not a measurement of the electricity or milk used in your office.
For coffee and the environment, the soundest decision is the one whose evidence matches the claim, the actual drink and its real disposal route.
FAQ
Is instant coffee necessarily worse because it is more processed?
No. More factory processing does not automatically mean a greater total environmental impact. Humbert and colleagues’ 2009 assessment found spray-dried instant coffee performed better than the capsule and drip-filter alternatives it modelled. The result illustrates why farming, dose, preparation and waste must be assessed together, rather than judging a product by processing alone.
Does a certification label guarantee the lowest-carbon cup?
No. A certification establishes compliance with its particular requirements, not necessarily a comparative carbon footprint for the finished drink. Check what is certified and which environmental issues the standard addresses. Milk, brewing electricity, washing and waste still need consideration when assessing what is served at home or work.
Can I compare two products using their published carbon figures?
Only if the figures describe sufficiently comparable products and methods. Check the serving size, coffee dose, milk, included life cycle stages, electricity assumptions and treatment of waste. If those differ, a lower published number may reflect a narrower assessment rather than a genuinely lower-impact drink.
Where to go next
Read Carbon Footprint for a closer explanation of emissions accounting and comparisons, then Coffee and Climate Change for the relationship between coffee production and a changing climate. Return to Coffee and the Environment to explore the individual environmental topics.
Sources
-
Chéron-Bessou and colleagues, Sustainable Production and Consumption. Unravelling life cycle impacts of coffee: Why do results differ so much among studies? 2024, volume 47, pages 251 to 266.
https://www.sciencedirect.com/science/article/pii/S2352550924001027
Systematic review used for comparison methods, assessment boundaries and variation between systems. -
Usva and colleagues, The International Journal of Life Cycle Assessment. Carbon and water footprint of coffee consumed in Finland: life cycle assessment. 2020.
https://link.springer.com/article/10.1007/s11367-020-01799-5
Supply-chain study used for cultivation and consumption contributions, irrigation and preparation impacts. -
Agriculture, Ecosystems & Environment. Biophysical drivers of yield gaps and ecosystem services across different coffee-based agroforestry management types: A global meta-analysis. 2022, volume 337, article 108024.
https://www.sciencedirect.com/science/article/pii/S0167880922001736
Meta-analysis used for shade, yield and ecological trade-offs. -
Water Footprint Network. Product gallery: Coffee. Undated, drawing on Mekonnen and Hoekstra’s 2010 and 2011 work.
https://tools.waterfootprint.org/product-gallery/details.php?product=15
Source of the historical global-average water-footprint example. -
Hoekstra and colleagues, Water Footprint Network and Earthscan. The Water Footprint Assessment Manual: Setting the Global Standard. 2011.
https://www.waterfootprint.org/resources/TheWaterFootprintAssessmentManual_English.pdf
Used for green, blue and grey water definitions and interpretation. -
Ijanu, Kamaruddin and Norashiddin, Applied Water Science. Coffee processing wastewater treatment: a critical review on current treatment technologies with a proposed alternative. 2020, published online in November 2019.
https://link.springer.com/article/10.1007/s13201-019-1091-9
Used for wastewater pollution and oxygen-demand mechanisms. -
Khanpit, Viswanathan and Hinrichsen, Journal of Cleaner Production. Environmental impact of animal milk vs plant-based milk: Critical review. 2024, volume 449, article 141703.
https://www.sciencedirect.com/science/article/pii/S095965262401151X
Used for milk-production mechanisms and differences between environmental indicators. -
Kovanen and colleagues, The International Journal of Life Cycle Assessment. Advancing methods for comparative nutritional LCA of milk and plant-based milk substitutes. 2025, published online in November 2024.
https://link.springer.com/article/10.1007/s11367-024-02407-6
Used for environmental and nutritional comparison limitations. -
Humbert and colleagues, Journal of Cleaner Production. Life cycle assessment of spray dried soluble coffee and comparison with alternatives (drip filter and capsule espresso). 2009, volume 17, pages 1351 to 1358.
https://www.sciencedirect.com/science/article/pii/S0959652609001474
Used for modelled brewing-system comparisons and preparation improvements. -
Department for Environment, Food & Rural Affairs. Simpler recycling: workplace recycling in England. Published 2024, updated 3 October 2025.
https://www.gov.uk/guidance/simpler-recycling-workplace-recycling-in-england
Used for England’s workplace requirements and compostable-packaging exclusions. -
Competition and Markets Authority. Making environmental claims on goods and services. 2021, Green Claims Code guidance.
https://www.gov.uk/government/publications/green-claims-code-making-environmental-claims/environmental-claims-on-goods-and-services
Used for interpreting and substantiating environmental claims. -
Smithsonian’s National Zoo and Conservation Biology Institute. Become Bird Friendly Certified. Undated.
https://www.nationalzoo.si.edu/migratory-birds/become-bird-friendly-certified
Used only for the programme’s own certification requirements. -
Sarmento dos Muchangos and colleagues, Environmental Impact Assessment Review. A systematic review of life cycle assessment and environmental footprint for the global coffee value chain. 2025, article 107740.
https://www.sciencedirect.com/science/article/pii/S0195925524003275
Used for life cycle stages and the diversity of assessment scopes.
This article was researched through peer-reviewed assessments and reviews, water-accounting references, official UK guidance and the certification programme’s own requirements; no first-hand environmental testing was undertaken.
Last checked: November 2026